NeurIPS 2025
Dec 2025Mining every NeurIPS 2025 paper to surface the most-supported and most-contradicted claims in the field
Motivation
I went to NeurIPS 2025. There were 5,846 papers this year and the field moves fast, so I kept wondering: how many of these papers actually contradict each other?
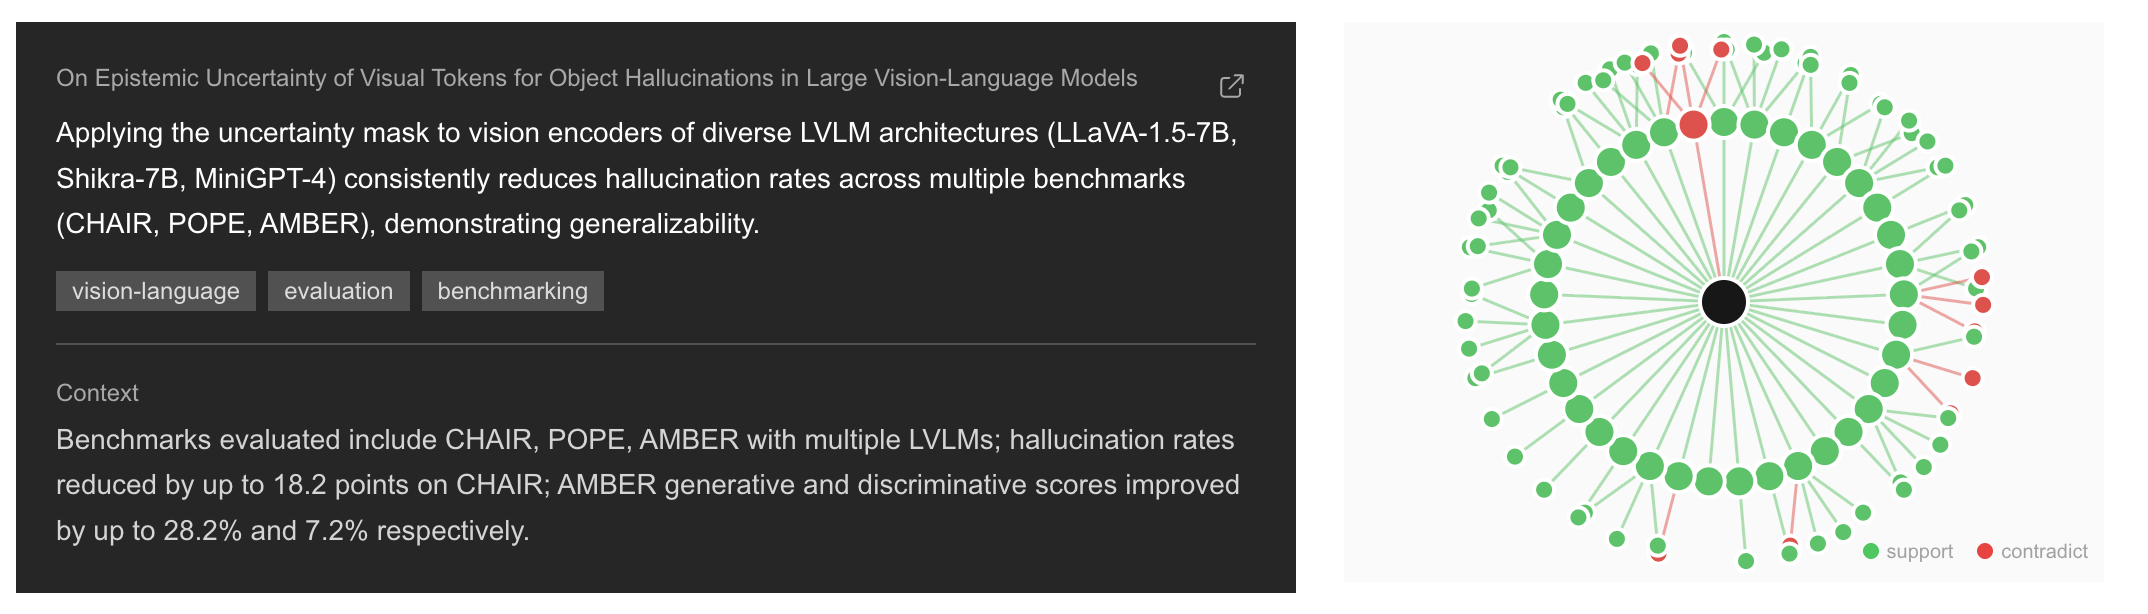
You can't read all of them. But you can have an LLM pull the main claims out of every paper, embed those claims, find the closest matches in the rest of the corpus, and ask another LLM whether each pair agrees or disagrees. The result is a graph. The interesting nodes are the most-supported and most-contradicted claims.
Numbers
- 5,846 papers (every accepted NeurIPS 2025 paper)
- 46,771 extracted insights with 1536-d embeddings
- 53,443 classified relations between insights
- 49,021 supporting and 4,422 contradicting (~8.3% disagreement)
Phase 1 - extraction
Goal of this phase: turn 5,846 PDFs into a queryable table of embedded claims. It runs once, end-to-end, and writes to Postgres. Nothing downstream depends on it being live.
Parse. Each PDF is split into title, abstract, and section-level chunks. Chunks are sized to fit a single claim with enough surrounding context.
Extract. Each chunk goes through gpt-4.1-mini with a structured tool call (see schema below). The model returns 1-30 claims per chunk, each one short and self-contained ("method X improves Y by Z on benchmark W"), plus 1-5 lowercase topic tags and a short quantitative context string. Keeping each claim self-contained is what makes embeddings discriminate later.
Embed and store. Every insight string is embedded with
text-embedding-3-small (1536-d) and inserted into a single
insights table in Postgres with the pgvector extension. The
embedding column has an HNSW index on cosine distance. End of phase.
{
  "name": "extract_insights",
  "description": "Pull self-contained claims out of a paper chunk.",
  "parameters": {
    "type": "object",
    "required": ["insights"],
    "properties": {
      "insights": {
        "type": "array",
        "minItems": 1, "maxItems": 30,
        "items": {
          "type": "object",
          "required": ["insight", "tags"],
          "properties": {
            "insight": { "type": "string", "minLength": 10 },
            "context": {
              "type": "string",
              "description": "numbers, %, metrics, conditions"
            },
            "tags": {
              "type": "array",
              "minItems": 1, "maxItems": 5,
              "items": { "type": "string" }
            }
          }
        }
      }
    }
  }
}
Phase 2 - search and classification
This phase reads the table that phase 1 produced. It does not need phase 1 to be running. You could rerun phase 2 with different parameters (different k, different prompt) without re-extracting anything.
Nearest neighbours. For each insight, do an approximate kNN over the HNSW index to get the top-k closest insights from other papers. These are candidates: topically nearby, not necessarily in agreement. Pure embedding similarity can't tell "X says scale helps" from "X says scale doesn't help" because both look semantically close.
Classify. Each candidate pair (focal insight, neighbour) is sent
to gpt-4.1-mini with a second tool call (see schema below). The
model labels each pair as supporting or contradicting and
returns a short reasoning string. Pairs the model considers
unrelated are simply omitted from the response, which keeps the
schema small and the labels honest.
The output is the insight_relations table: 53,443 directed edges,
49,021 supporting and 4,422 contradicting.
{
  "name": "compare_insights",
  "description": "Label each candidate as supporting or contradicting the focal insight.",
  "parameters": {
    "type": "object",
    "required": ["relations"],
    "properties": {
      "relations": {
        "type": "array",
        "items": {
          "type": "object",
          "required": ["other_id", "relation", "reasoning"],
          "properties": {
            "other_id": { "type": "integer" },
            "relation": { "enum": ["supporting", "contradicting"] },
            "reasoning": { "type": "string", "minLength": 10 }
          }
        }
      }
    }
  }
}
Querying
With the graph in Postgres you can ask things like "which claims have the most contradicting evidence?", "show me all papers that disagree with paper X", or "find the claim most supported across the corpus". The HNSW index makes per-claim neighbour lookups cheap, so the same infrastructure works for an interactive web UI on top.
Technology
Postgres, pgvector (HNSW, cosine), OpenAI gpt-4.1-mini for extraction and classification, text-embedding-3-small for embeddings, Python + Alembic for the pipeline, Next.js + Three.js for the visualisation.